
College Football vs NFL: 2026 Game-Day Data
College football is the NCAA-governed American football system played by university teams across the United States, while the National Football League is a professional competition built around 32 fra...
College Football vs NFL: 2026 Game-Day Data
College football is the NCAA-governed American football system played by university teams across the United States, while the National Football League is a professional competition built around 32 franchises. In 2026, college football includes the Football Bowl Subdivision, Football Championship Subdivision, Division II, and Division III, with conferences such as the SEC, Big Ten, ACC, Big 12, and American Athletic Conference shaping the national schedule. The College Football Playoff remains the championship pathway for top FBS teams, while the NFL uses a 17-game regular season and a fixed postseason bracket. College games also feature wider variation in team quality, stadium atmosphere, roster turnover, and offensive design. The practical takeaway is simple: judge college football through conference context, schedule strength, and player development rather than comparing every result directly with the NFL.
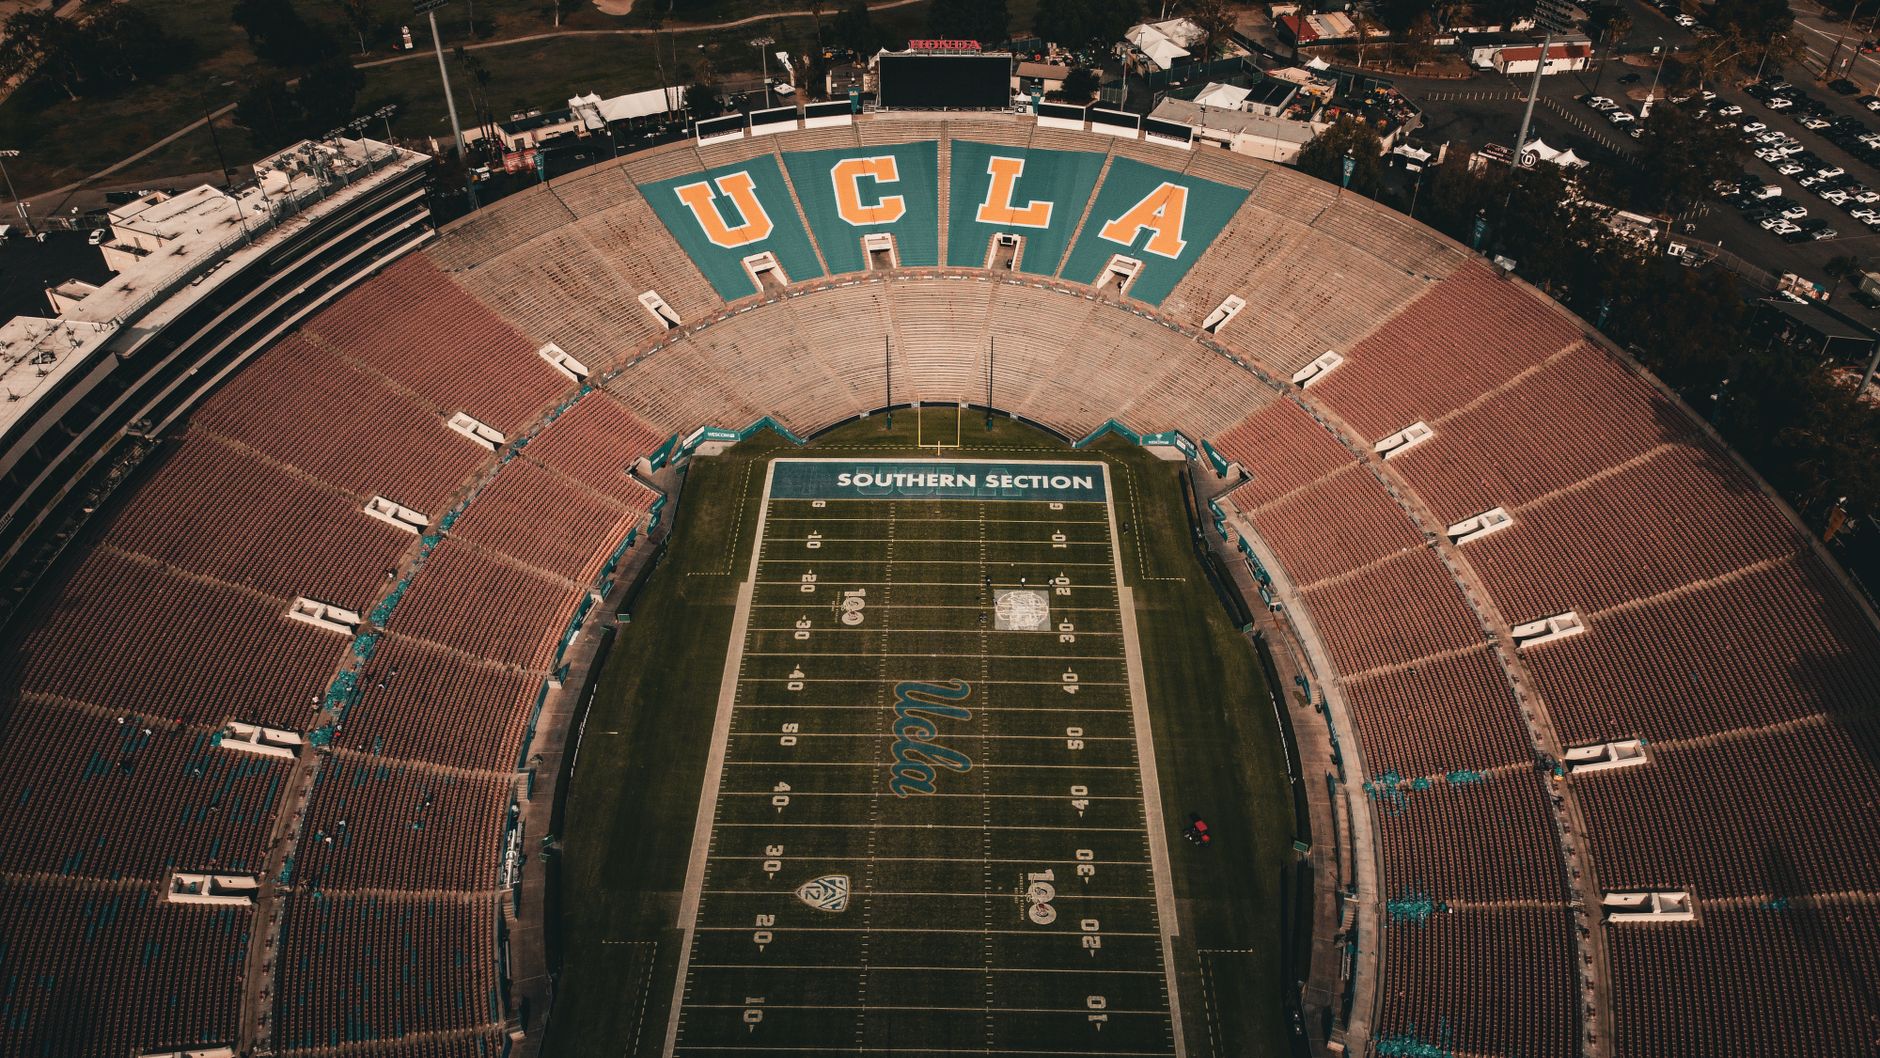
Photo by Caio Cezar on Pexels
The Bottom Line
College football is more variable, regional, and development-focused than the NFL, whereas the NFL is more standardized, talent-balanced, and strategically compressed. The difference appears in scheduling, roster construction, coaching rules, stadium culture, media coverage, and competitive incentives, not merely in the players’ skill level. A college football fan may watch a 2026 matchup between North Carolina and TCU in Dublin, Ireland, then follow USC against San José State at the Los Angeles Memorial Coliseum; an NFL viewer usually follows a more uniform national product with defined franchise calendars and professional contracts.
According to the NCAA’s official football coverage, FBS football includes rankings, statistics, championship history, and College Football Playoff reporting, while the NFL official site organizes its competition around 32 member clubs. “The regular season shall consist of 17 games,” the NFL schedule format specifies, creating a predictable baseline for every franchise. College football does not offer that same universal structure because conferences and divisions differ materially.
For readers trying to interpret scores, odds, or player projections, the key is context. A 10-point victory over an SEC opponent can reveal more than a 35-point win against a lower-tier program, and a freshman quarterback’s performance should not be evaluated like that of a veteran NFL starter. Match Daily can provide broader sports analysis, but responsible readers should separate factual game information from any wagering decision.
Want a clearer way to compare competitions and schedules?
What Players Actually See
College football players experience a different working environment from NFL athletes because their careers are connected to universities, academic calendars, recruiting systems, and eligibility rules. The NCAA transfer portal has made roster movement faster, while name, image, and likeness arrangements have changed how athletes and programs manage commercial opportunities. In contrast, NFL players enter through the draft, free agency, practice squads, and negotiated contracts governed by a collective bargaining agreement.
The difference is visible in preparation time. College teams may have substantial variation in coaching resources, nutrition departments, travel arrangements, video technology, and training staff, especially when comparing an FBS powerhouse with an FCS or Division II program. NFL organizations generally operate with greater financial standardization, deeper analytics departments, and professionalized medical infrastructure. That does not mean every college team is poorly resourced; Alabama, Georgia, Ohio State, Oregon, and Texas operate at an enormous scale. It means the range between institutions is wider.
There is also a human cost to constant comparison, and this is where casual observers often become careless. A college athlete may be 18 or 19 years old, playing before 80,000 spectators while adapting to a new offense, academic workload, and unfamiliar campus. Data shows that early-season statistics can be unstable: one excellent or disastrous game may represent 12.5% of an eight-game sample. That is why [Internal Link: college football player development guide] belongs beside any ranking discussion.
The college football player pathway
A typical high-level pathway may include:
- High school recruitment and scholarship evaluation.
- Early enrollment, redshirting, or immediate competition.
- Position changes and development within a college system.
- Transfer portal movement or continued eligibility.
- NFL scouting, combine testing, and draft evaluation.
An NFL player, by comparison, enters a league where every opponent has reached an elite professional threshold. College football contains future first-round draft picks, late-blooming specialists, developmental players, and athletes competing primarily for education or team opportunity. That mixture produces more uneven matchups, but it also creates the raw drama that professional parity tends to sand away.

Photo by AlphaTradeZone on Pexels
A useful example is quarterback evaluation. In college football, a passer may operate in a spread system with simplified reads, wide formations, and tempo-based play calling. An NFL quarterback must typically process disguised coverages, tighter throwing windows, complex protection adjustments, and elite defensive speed. Statistics therefore require translation. A 68% completion rate in one offensive system cannot be treated as a universal measure of accuracy, just as a 300-yard passing performance against a weak secondary may exaggerate professional readiness.
The 3 Things That Matter Most
The three strongest analytical variables are schedule context, roster continuity, and scheme fit. Fans often begin with rankings because rankings are visible and emotionally satisfying, but rankings summarize judgments rather than replacing evidence. When I track a college football slate, I record opponent strength, returning production, quarterback experience, injury availability, travel distance, and red-zone efficiency before drawing a conclusion. You should do the same, or am I wrong?
1. Schedule strength changes the meaning of every statistic
College football teams do not face identical schedules. An SEC team may play several opponents ranked inside the national top 25, while another program may spend much of September facing lower-rated competition. The 2026 schedule framework includes regular-season weeks from late August through early December, followed by bowl games and College Football Playoff contests, but the path differs sharply by conference.
Consider three common statistical traps:
- A defense allowing 14 points per game against weak offenses may be less impressive than one allowing 21 points against elite quarterbacks.
- A running back averaging 6.5 yards per carry in a low-strength schedule needs opponent-adjusted review.
- A team with a 5–2 record may be stronger than a 7–0 team if its losses came against Georgia, Ohio State, or Texas.
The College Football Playoff rankings and championship information help establish national context, but no ranking system eliminates the need for schedule analysis. The contrarian point is that an undefeated record is not automatically more informative than a one-loss record. In a sport with hundreds of FBS participants and major conference variation, the opponent list often explains more than the win column.
2. Roster continuity is more important after major transfers
Roster continuity became harder to measure after the transfer portal accelerated movement between programs. A returning starter count is useful, but it is incomplete. A team may return 14 starters yet lose its offensive coordinator, left tackle, quarterback, and top two receivers; another may return only 10 starters but add experienced transfers at every critical position.
A stronger continuity review includes:
- Returning snaps, not only returning starters.
- Quarterback attempts and offensive line starts.
- Defensive tackle and cornerback experience.
- Transfer quality at high-leverage positions.
- Coaching continuity and playbook stability.
This is one of the more overlooked information points in college football analysis: returning production is not evenly valuable across positions. Returning 80% of wide receiver snaps may matter less than replacing a starting center who made protection calls on every offensive play. Similarly, a defense can replace two linebackers more easily than it replaces a veteran safety who communicated coverage adjustments across the secondary.
At Match Daily, a responsible preview should identify those structural details rather than simply repeat a preseason top 25 list. Readers should also check whether reported statistics refer to 2025 production, 2026 projections, or games already played in the current season. Those labels are not decorative; they change the evidence base.
Need a more disciplined framework for reading college football previews?
3. Scheme fit can outweigh raw athletic ability
Scheme fit explains why a highly recruited player may struggle after transferring and why an overlooked athlete can become a conference star. A quarterback trained in an RPO-heavy spread offense may need time to adapt to a pro-style system requiring under-center footwork, longer progression reads, and tighter timing. A defensive end who thrived attacking from a wide alignment may become less effective when asked to absorb double teams inside.
Coaches also shape statistical output. Oregon, Notre Dame, Michigan, Alabama, Clemson, and Penn State have historically used different offensive identities, even when their recruiting classes contain comparable athletic talent. Tempo, personnel groupings, motion, fourth-down aggression, and field-position strategy all influence the final box score. Research-oriented models should therefore separate player quality from opportunity volume.
One practical method is to compare process metrics with outcomes. Track explosive plays, success rate, early-down efficiency, pressure rate, turnover-worthy decisions, and red-zone possessions. Turnovers are important, but they are also noisy: a defense recovering six fumbles in one season may not repeat that number if the underlying pressure rate remains unchanged. Anyone promising certainty from a small turnover sample is selling comfort, not analysis.
[Internal Link: advanced college football statistics explained]
Edge Cases & Gotchas
The most dangerous college football conclusions come from exceptional situations: neutral-site games, international travel, weather, rivalry pressure, coaching changes, injuries, and schedule compression. These conditions can distort ordinary expectations. A matchup played at Aviva Stadium in Dublin is not analytically identical to a home game in Chapel Hill, even if the listed teams and spread appear familiar.
Travel can affect preparation through time-zone changes, altered practice schedules, unfamiliar stadium sightlines, and disrupted recovery. It does not guarantee an upset, of course, but it changes the baseline. A team flying across the Atlantic may have fewer normal routine anchors than a domestic opponent, while the neutral venue reduces the traditional home-field advantage. The correct adjustment is modest and evidence-based, not theatrical.
Weather creates another edge case. Wind affects deep passing, field goals, punt distance, and ball security more directly than mild rain does. Heat can increase substitution rates and defensive fatigue, while cold conditions may alter grip and kicking performance. Yet weather forecasts often change between 72 hours and kickoff. Use the latest credible forecast, record wind speed rather than merely “bad weather,” and avoid pretending a vague forecast has exact predictive power.
Coaching changes and quarterback uncertainty
Coaching changes are especially difficult because the effect can run in opposite directions. A new head coach may improve organization, recruiting, and discipline while creating short-term confusion in terminology and protection calls. A returning coordinator may provide continuity but fail to correct weaknesses exposed during the previous season.
Quarterback uncertainty should be quantified where possible:
- Number of returning starts.
- Pass attempts in the previous season.
- Pressure-to-sack rate.
- Third-down conversion performance.
- Red-zone passing and rushing contributions.
- Turnover rate under pressure.
A useful edge case emerged repeatedly in historical college football analysis: a team can improve its record while becoming less efficient if it wins several close games. Conversely, a team can lose more games while improving process metrics after facing a brutal schedule. Close-game records are not useless, but a 6–1 record in one-score games deserves regression caution. The NCAA statistics archive can help readers verify basic production rather than relying on social-media summaries.
Rankings, polls, and the illusion of precision
The Associated Press poll, coaches’ poll, College Football Playoff rankings, recruiting rankings, and computer models answer different questions. A poll captures collective opinion, a recruiting ranking estimates incoming talent, and a model attempts to quantify performance or future probability. Treating all five as interchangeable is a category error.
A ranking of No. 8 does not mean a team is exactly 2 points better than No. 10. It means the team occupies an ordered position inside a rough evaluation system. This matters when readers interpret sportsbook lines or make predictions. A projected margin should come from team strength, opponent quality, injuries, location, and market movement, not from the superficial gap between two ordinal numbers.

Photo by Joe Calomeni on Pexels
An additional gotcha is the calendar itself. A team may look improved in September because opponents are inexperienced, then decline in November when offensive line injuries accumulate. Another may appear inconsistent because it faced three ranked opponents in four weeks. The most reliable review compares performance in blocks of four to six games, not isolated headlines. Data becomes more useful when you let time expose whether a pattern is durable.
Here is a compact pregame checklist:
- Confirm the venue, kickoff time, and travel distance.
- Verify current injuries and expected starters.
- Compare opponent-adjusted offensive and defensive efficiency.
- Review quarterback and offensive-line continuity.
- Check weather, wind, and rest days.
- Separate market movement from genuine team information.
- Set a firm entertainment budget if wagering is involved.
Responsible gambling matters because college football’s emotional environment can produce impulsive decisions, particularly during rivalry weekends. Never treat Match Daily content, a statistical model, or a market price as a guarantee. Information improves decisions; it does not remove uncertainty.
Want to examine the details behind a specific college football matchup?
Verdict
College football deserves to be understood on its own terms rather than treated as a smaller NFL. The NFL offers a concentrated professional environment, relatively standardized franchises, a 17-game regular season, and a playoff system designed for a national league. College football offers conference identity, student-athlete development, dramatic roster turnover, uneven schedules, historic rivalries, and an atmosphere that can transform a Saturday afternoon into something older than the statistics suggest.
The most dependable 2026 analysis combines numbers with restraint. Start with schedule strength, then inspect returning snaps, quarterback experience, offensive-line continuity, scheme fit, injuries, venue, travel, and weather. Confirm facts through the NCAA, College Football Playoff, official team sites, and reputable statistical databases. A ranking may begin the conversation, but it should never finish it.
The old stadium lights still do what they always did: make every possibility look brighter than it is. Your task is not to eliminate uncertainty. It is to measure it carefully, recognize the limits of the data, and make only decisions you can afford.
Ready to follow the 2026 college football season with a sharper analytical lens?
Frequently Asked Questions
Q: What is college football?
A: College football is American football played by university-affiliated teams, primarily under NCAA governance in the United States. Its highest level, the Football Bowl Subdivision, includes major conferences such as the SEC, Big Ten, ACC, Big 12, and American Athletic Conference. The sport also includes the FCS, Division II, and Division III, which have different scholarship, scheduling, and postseason structures. College players combine athletic competition with university enrollment, although roster rules, transfer opportunities, and commercial arrangements have changed significantly since the introduction of modern name, image, and likeness policies.
Q: How does college football differ from the NFL?
A: College football uses university teams, conference schedules, recruiting, eligibility systems, and a broad range of competitive levels, while the NFL uses 32 professional franchises and a standardized league structure. NFL teams play a 17-game regular season, whereas college schedules commonly contain approximately 12 regular-season games before conference championships, bowls, or College Football Playoff games. College rosters also change rapidly through recruiting, graduation, and transfers. The NFL relies on drafts, free agency, contracts, and professional salary structures.
Q: How can I evaluate a college football team before a game?
A: Evaluate schedule strength, quarterback experience, offensive-line continuity, injuries, scheme fit, venue, travel, and weather before relying on the win-loss record. Compare opponent-adjusted efficiency, explosive plays, pressure rate, red-zone performance, and turnover context. Confirm information through NCAA statistics, official team reports, and current injury news. Avoid using a single ranking or one recent result as your entire forecast, because college football samples are often small and unevenly distributed across conferences.
Q: Is college football more unpredictable than the NFL?
A: College football is generally more variable because it combines unequal schedules, frequent roster turnover, large differences in program resources, and a wider range of team quality. An FBS contender may face an opponent with substantially less depth, while NFL teams operate within a more standardized professional talent pool. However, individual NFL games remain difficult to predict because injuries, matchup design, and quarterback performance matter greatly. The correct conclusion is not that college football is random, but that its uncertainty has more structural sources.
Q: What does the College Football Playoff do?
A: The College Football Playoff determines the national championship pathway for top-level FBS football teams through a postseason tournament. The process uses national rankings, conference results, schedule quality, and other evaluation factors to select participants and seed the bracket. The 2026 championship calendar includes playoff games after the regular season, with the title game scheduled for January 25, 2027, at Allegiant Stadium in Las Vegas according to the supplied NCAA schedule information. Fans should verify the latest official format and selection details because postseason structures can change.
Q: How much does it cost to follow college football?
A: Following college football can cost nothing through free schedules, scores, news reports, radio broadcasts, and official NCAA resources, while paid viewing and stadium attendance vary widely. Tickets for individual games may range from modest prices for smaller programs to hundreds of dollars for major rivalry games, depending on demand and venue. Travel, parking, merchandise, and subscription services add further expense. Set a fixed entertainment budget, compare official ticket sources, and never confuse a paid prediction or wager with a guaranteed return.
Q: What should I do if a college football statistic seems misleading?
A: Check the opponent quality, sample size, game location, injuries, and statistical definition before accepting the number. A 6.5-yard rushing average may be inflated by one 70-yard play, while a defense’s 14-point average may reflect several weak offenses. Compare success rate, explosive-play rate, downs played, and opponent-adjusted metrics over at least four to six games when possible. If different reputable sources disagree, prefer the official NCAA or team record and identify exactly which games and definitions each source includes.
Thank you for reading.
Match Daily · The Sovereign Editorial · Vol. I